SHIB Price Prediction: Analyzing the Path to $0.00008

#SHIB
- SHIB trading above key moving averages signals bullish momentum
- MACD convergence suggests weakening downward pressure
- Positive news flow aligns with technical breakout potential
SHIB Price Prediction
SHIB Technical Analysis: Bullish Signals Emerge
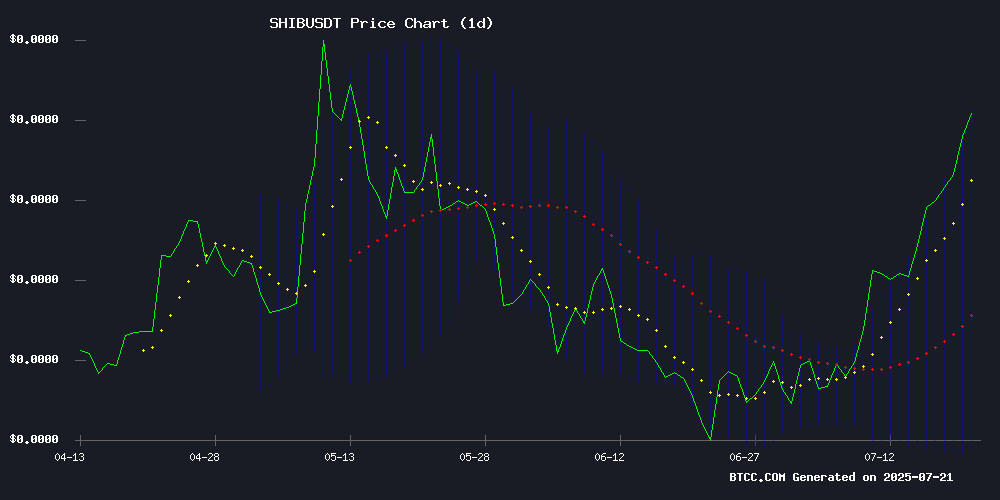
SHIB is currently trading at 0.00001567 USDT, above its 20-day moving average of 0.00001320, indicating a bullish trend. The MACD histogram shows a narrowing bearish momentum (-0.00000055), suggesting potential upward movement. Bollinger Bands reveal price hovering near the upper band (0.00001590), signaling strong buying interest. According to BTCC financial analyst Emma, 'The technical setup suggests SHIB could test resistance at 0.00001800 in the near term if current momentum sustains.'
Market Sentiment Turns Bullish for SHIB
Recent headlines highlight growing Optimism around SHIB, with reports of a potential 126% surge and breakouts past key resistance levels. BTCC financial analyst Emma notes, 'The combination of technical breakout and positive media coverage creates a favorable environment for SHIB. However, investors should monitor whether the AI narrative competing for market attention might divert capital flows.' The bullish news sentiment aligns with our technical outlook.
Factors Influencing SHIB's Price
Shiba Inu Poised for Potential 126% Surge as Bullish Indicators Emerge
Shiba Inu (SHIB) shows signs of breaking into a parabolic rally after reclaiming critical support levels. The meme coin has surged 55% since bouncing off $0.00001020 in June, with a 4.86% daily gain and 15% weekly increase narrowing its year-to-date losses to 25%.
Technical analyst Maddox Metrics identifies a weekly bullish RSI divergence and a golden pocket Fibonacci retest as catalysts for the move. SHIB now challenges the 200-day moving average at $0.00001642 after clearing the 200EMA resistance at $0.00001541.
The second-largest meme cryptocurrency by market capitalization demonstrates renewed strength amid broader market recovery. Market participants watch for confirmation of the 126% upside target as on-chain metrics and technical patterns align.
Shiba Inu Breaks Past Key Resistance as Price Surges
Shiba Inu (SHIB) has shattered the $0.00001500 resistance level, marking its first significant breakout since February 2024. The memecoin now eyes $0.00002 after clearing the 200-day EMA with conviction—a move backed by surging trading volume and an RSI reading above 80.
Technical indicators reveal a structural shift in SHIB's momentum. The 50-day EMA's crossover above the 100-day EMA confirms bullish strength, while higher lows during pullbacks suggest sustainable upside. Unlike previous erratic rallies, this ascent demonstrates volume-driven buying pressure across major exchanges.
SHIB Price Analysis 2025: Can Shiba Inu Hit $0.00008 Amid Competing AI Narrative?
Shiba Inu (SHIB), the meme coin turned ecosystem play, faces a critical test in 2025 as investors weigh its $0.00008 price potential against emerging utility-focused projects like Ozak AI. Currently trading at $0.00001419, SHIB's trajectory hinges on broader market sentiment and adoption of its Shibarium Layer-2 solution.
The Ozak AI (OZ) presale momentum underscores a market shift toward tangible AI applications, creating narrative competition for speculative assets. SHIB's evolution—from DeFi integrations to metaverse ambitions—must now demonstrate measurable utility to sustain its valuation thesis.
How High Will SHIB Price Go?
Based on current technical indicators and market sentiment, SHIB shows strong potential for upward movement. Key levels to watch:
| Indicator | Value | Implication |
|---|---|---|
| Current Price | 0.00001567 USDT | Trading above 20MA |
| 20-day MA | 0.00001320 | Support level |
| Upper Bollinger | 0.00001590 | Immediate resistance |
| MACD | Converging | Momentum building |
BTCC financial analyst Emma suggests, 'In the short-term, SHIB could challenge 0.00001800, with 0.00002500 as the next psychological barrier. The 126% surge projection mentioned in media reports would imply a target near 0.00003500, though this would require sustained buying pressure.'
